Protected Content
This whitepaper is protected against direct printing.
To get the official PDF:
- Visit: controlterrestre.com/whitepapers
- Select the whitepaper of your interest
- Complete the form with your information
- Download the professional PDF with optimized format
Freight Transportation in the United States: 2026 Analysis
Contents
- Chapter 1: The State of the FTL Market in 2026
- Chapter 2: Capacity and Rate Dynamics
- Chapter 3: Nearshoring and the Cross-Border Corridor
- Chapter 4: Labor and Regulatory Challenges
- Chapter 5: Logistics Hubs and Strategic Corridors
- Chapter 6: Technology and Innovation in FTL
- Chapter 7: Strategies for Shippers
- Chapter 8: Conclusions and Projections 2026-2035
- References
Chapter 1: The State of the FTL Market in 2026
The trucking industry in the United States finds itself at a historic inflection point. During 2024, the sector generated gross revenues of approximately $906 billion dollars, moving a total of 11.27 billion tons of goods. Although this figure represents a slight contraction from the trillion dollars reached in 2023, it underscores the absolute dominance of ground transportation in the American economy.
Dominance of Ground Transportation
The truck continues to be the undisputed king of American logistics:
- 72.7% of total freight tonnage moved in the country
- 76.9% of total freight transportation revenues
- 8.4 million direct jobs in the industry
These figures demonstrate that, despite advances in rail and intermodal transportation, the truck remains indispensable for the North American economy.
FTL Market Size
The full truckload (FTL) segment constitutes the backbone of domestic and international trade. The FTL market in the United States reached a value of $448.65 billion dollars at the beginning of 2025, with a compound annual growth rate (CAGR) of 3.39% projecting it to exceed $547.89 billion by 2031.
| Market Metric | 2024-2025 Data | 2031 Projection |
|---|---|---|
| Total Industry Revenue | $906 billion USD | $1.46 trillion USD (2035) |
| Freight Tonnage | 11.27 billion tons | 13.99 billion tons (2035) |
| FTL Market Size | $448.65 billion USD | $547.89 billion USD |
| Projected CAGR | 3.39% | |
Market Fragmentation
A defining characteristic of the FTL market is its extreme fragmentation:
- 91.5% of carriers operate fleets of 10 trucks or fewer
- 99.3% operate fewer than 100 power units
This fragmentation creates a highly volatile spot rate environment, while asset-based carriers dominate the procurement strategies of shippers seeking operational certainty and liability control.
Market Cycle Transition
The market is experiencing a significant transition from the so-called "freight recession" of previous years toward gradual stabilization. The exit of small carriers from the market and the reduction in Class 8 truck orders are balancing supply and demand, generating upward pressure on rates for this year and beyond.
Chapter 2: Capacity and Rate Dynamics
The dynamic between transportation capacity supply and demand defines the economic pulse of the FTL sector. During most of 2024 and 2025, the market remained in what is called a "shipper's market," characterized by abundant capacity that kept rates under control. However, conditions are changing rapidly.
The End of Oversupply
Several factors are recalibrating the capacity balance:
- Exit of independent operators: Financial pressure has forced many small carriers to leave the market
- Class 8 order reduction: Fewer new trucks entering the market
- KPI deterioration: Tender rejections are increasing, indicating tighter capacity
Any incremental uptick in volume or a supply disruption could trigger a sudden shift toward an inflationary rate environment.
Spot vs. Contract Rates
| Rate Type | YoY Variation | 2026 Trend | Margin Impact |
|---|---|---|---|
| Spot Rate (Baseline) | +1.8% | Volatile / Seasonal increase | Margin compression |
| Contract Rate | +2.1% | Stable / Moderate increase | Cost protection |
| Diesel Cost (Average) | $3.46 - $3.75 USD/gal | Variable by policy | 20-25% of cost per mile |
Operating Cost Pressure
Operating costs remain approximately 34% higher than in the past decade, exerting immense financial pressure on small fleets:
- Insurance: 36% increase over the last 8 years
- "Nuclear verdicts": High-impact litigation affecting premiums
- Maintenance: Increase due to aging fleets
- Diesel: Between $3.46 and $3.75 per gallon, representing 20-25% of cost per mile
2026 Outlook
The FTL market narrative for this year centers on "stability before the storm." Indicators suggest the market is ripe for a cyclical shift. Shippers must prepare for an environment where premium capacity will be more expensive and contract negotiation will require greater flexibility.
Chapter 3: Nearshoring and the Cross-Border Corridor
The nearshoring phenomenon is redefining North American logistics flows. The relocation of supply chains from Asia to Mexico and Central America represents one of the most significant transformations in international trade in recent decades.
Mexico: #1 U.S. Trading Partner
In 2024, bilateral trade between the United States and Mexico reached a record $839.9 billion dollars, a 5.1% increase from the previous year. Mexico surpassed Canada and China to position itself as the nation's leading trading partner.
Trucks move 85% of the value of goods across the Mexican border, underscoring the critical importance of ground infrastructure in this corridor.
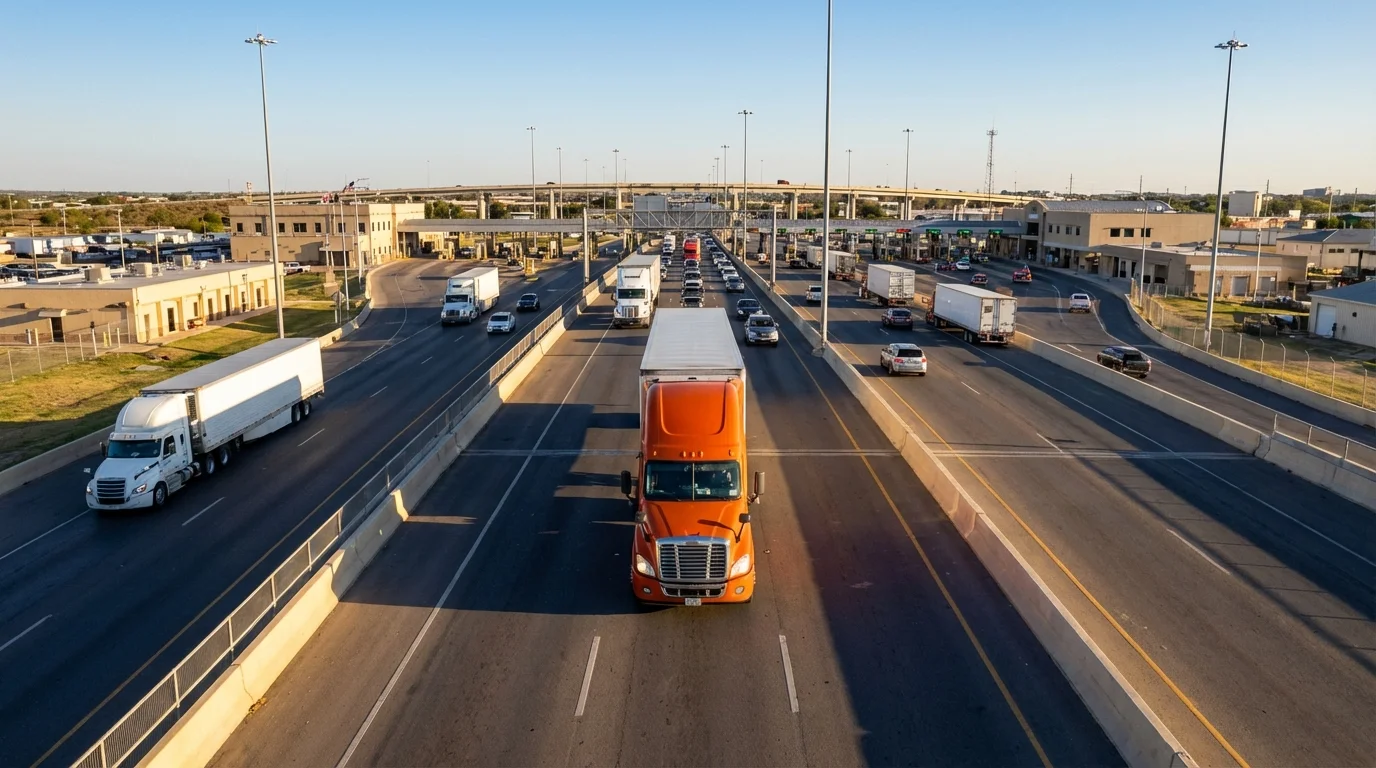
The Port of Laredo: North America's Central Node
Laredo has consolidated as the #1 trade port in the United States, processing more cargo value than any other point of entry:
- $339.03 billion in global trade processed in 2024
- 5.98% increase from the previous year
- Approximately 14,000 commercial trucks cross daily
Key Cross-Border Trade Sectors
| Trade Sector | Imports (2024) | Exports (2024) |
|---|---|---|
| Transportation Equipment | $141.3 billion | $94.0 billion |
| Electrical Machinery | $84.0 billion | $43.2 billion |
| Metals | $20.7 billion | $13.2 billion |
| Computers/Tech | $3.01 billion | N/A |
The Transit Time Advantage
The efficiency of nearshoring lies in a simple but powerful equation:
- Ground transportation Mexico-USA: 48 hours
- Transpacific maritime transport: 30 days
This difference has generated explosive demand for warehouses in Laredo, McAllen, and El Paso, as well as in the manufacturing hubs of Monterrey and Saltillo on the Mexican side.
Projections for Central America
Trade with Latin America, including Central America, is on an upward trajectory. The cross-border e-commerce market in the region is projected to exceed $200 billion dollars this year.
Countries like Honduras, Guatemala, and El Salvador are increasingly integrating into U.S. supply chains, using Mexico as the natural logistics bridge. The border crossings at Tapachula and Tecun Uman remain the main route for trade in industrial and consumer goods with Central America's Northern Triangle.
Chapter 4: Labor and Regulatory Challenges
The human factor represents the greatest limiting factor on transportation capacity today. Driver shortages, combined with an increasingly strict regulatory environment, define the operational challenges of the sector.
The Driver Crisis
The industry faces an estimated driver gap of more than 80,000 professionals. Contributing factors include:
- Aging workforce: The average age of drivers continues to increase
- High turnover: Exceeds 95% in certain market segments
- Detention time: 135.9 million hours lost annually without pay
- Insufficient compensation: Base salary grew only 2.4% last year
Environmental Regulations: EPA Phase 3
The EPA's "Phase 3 Greenhouse Gas Emissions Standards" rule represents the strictest regulation in history for heavy-duty vehicles. Starting with model year 2027:
- Manufacturers must significantly reduce CO2 emissions
- The cost of new equipment will increase substantially
- Greater pressure to adopt alternative technologies
- Renewable diesel emerges as a more viable short-term solution than full electrification
Safety Certifications and Border Access
Voluntary certifications have become de facto requirements for high-level operations:
- C-TPAT (Customs-Trade Partnership Against Terrorism): Reduced crossing times and lower inspection frequency at the southern border
- FAST (Free and Secure Trade): Expedited clearance of low-risk goods, requiring carrier, driver, and importer to be certified
- CSA Scores: The FMCSA metric for evaluating risk. A score close to 0 in all seven BASIC categories is fundamental for fleet reputation
The Human Approach as a Differentiator
Successful companies are shifting toward a "people-first" culture:
- Health and Wellness: Investments in cab ergonomics, preventive programs, and psychological support
- Respect for time: Reduction of unpaid detention time
- Support technology: ADAS systems and AI dispatch to reduce stress, not to replace
Chapter 5: Logistics Hubs and Strategic Corridors
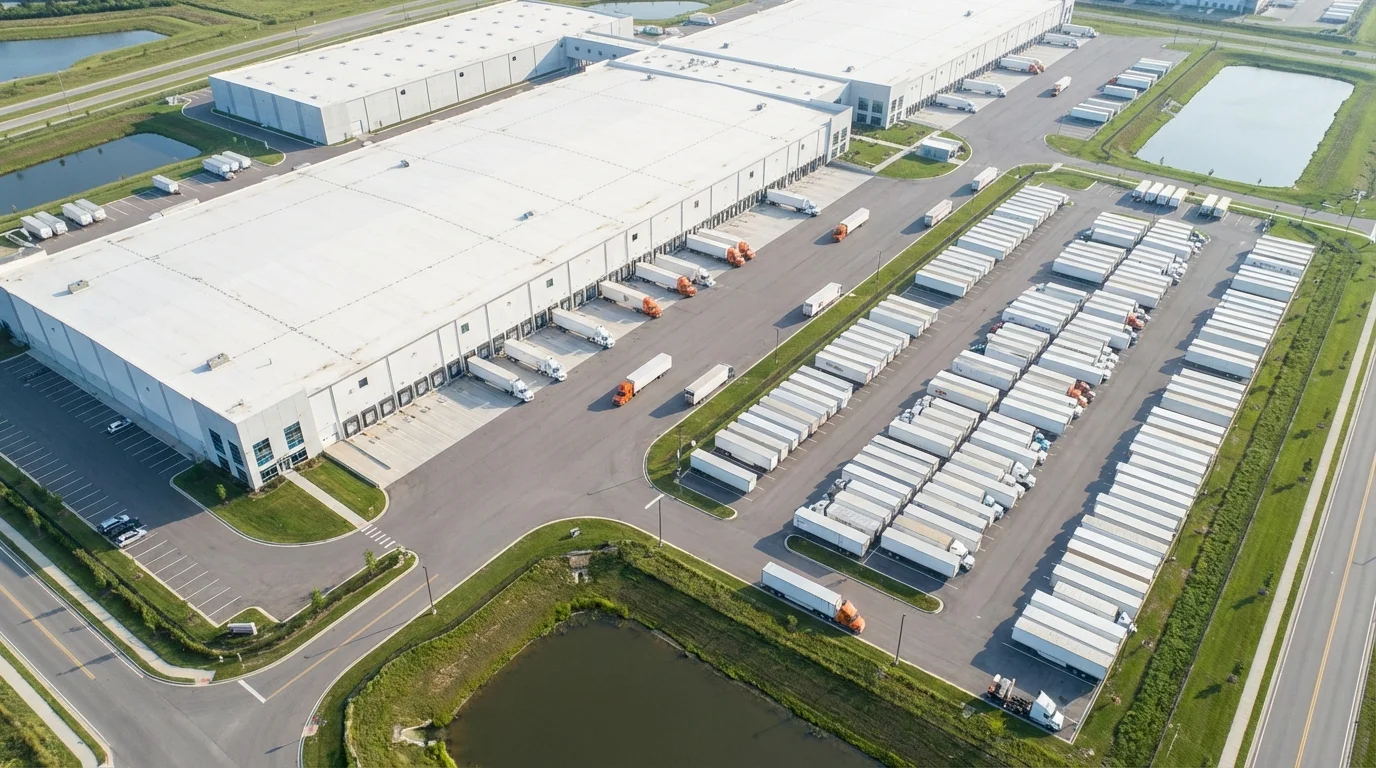
FTL transportation efficiency fundamentally depends on proximity to major population centers and multimodal transportation infrastructure. Strategic hub selection is critical for profitability in a high operating cost environment.
1. Atlanta, Georgia
Remains the main hub of the American Southeast. Its strategic location allows reaching 80% of the U.S. population within two days of driving. It is a fundamental node for retail and consumer freight, with direct access to interstates I-20, I-75, and I-85.
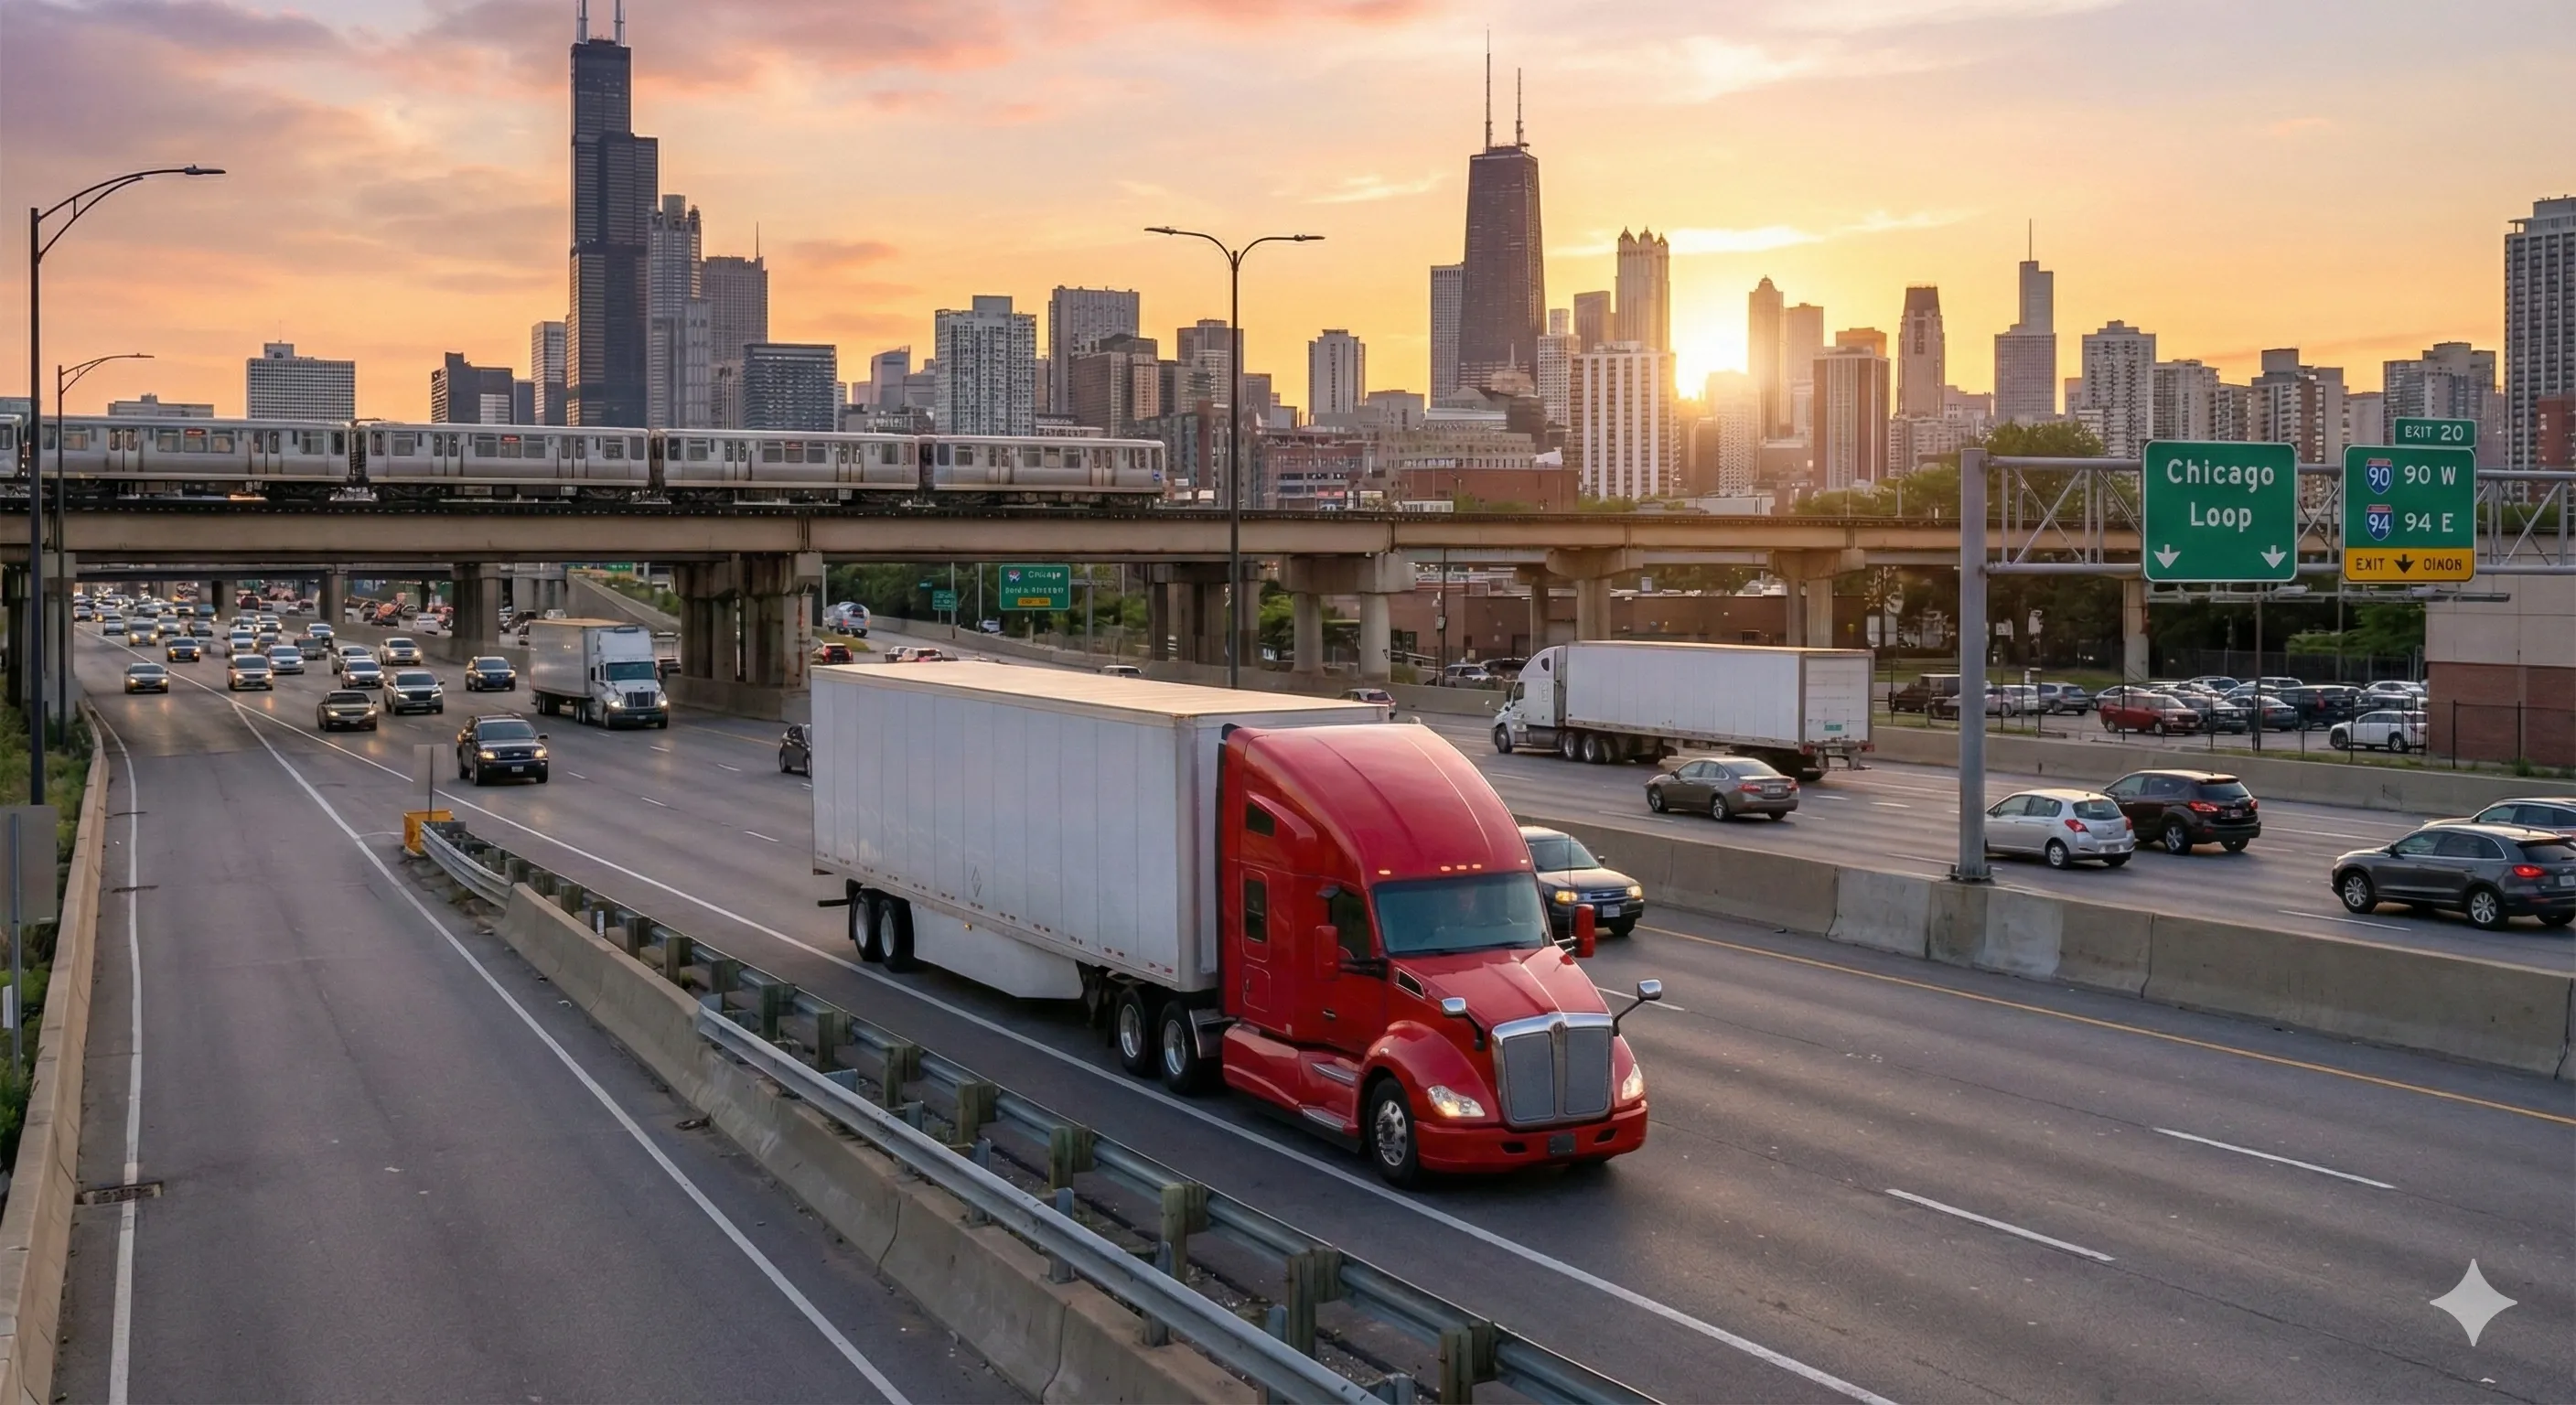
2. Chicago, Illinois
The "Crossroads of America" for the Midwest. It is the only point where all seven Class I railroads converge, making it the most advanced intermodal system in the country. Chicago handles more freight by volume than any other hub in North America.
3. Dallas-Fort Worth, Texas
A massive inland hub with logistics costs 23% lower than coastal cities. DFW is vital for cross-border trade with Mexico and has a constantly expanding manufacturing and warehousing base. The convergence of interstates I-35 and I-20 makes it indispensable.
4. Memphis, Tennessee
Home to FedEx's global SuperHub, Memphis is the busiest cargo airport in the world. Its quadruple connectivity—air, river (Mississippi), rail, and highway—makes it indispensable for expedited freight and medical supplies.
5. Los Angeles / Inland Empire, California
The undisputed gateway for Asian imports. The ports of Los Angeles and Long Beach handle 40% of U.S. imports, feeding a colossal warehouse ecosystem in the Inland Empire that serves retail giants.
Major Seaports
| Port | TEU Volume (Millions) | Specialization | Main Route |
|---|---|---|---|
| Los Angeles | 9.5 | Automated terminals | Transpacific (Asia) |
| NY/NJ | 9.0 | Mega-ship access | Transatlantic (Europe) |
| Long Beach | 8.2 | Green initiatives | Transpacific (Asia) |
| Savannah | 6.0 | Garden City expansion | Retail/Southeast |
| Houston | 3.5 | Energy/LNG | Gulf/Global |
Main Highway Corridors
The National Highway Network comprises approximately 200,000 miles designed to support interstate commerce:
- I-35 Corridor: Crucial for USMCA, connecting Laredo with Dallas, Austin, San Antonio, and northward to Canada. Thousands of trucks daily with automotive components and electronics.
- I-10 Corridor: Crosses the south from Santa Monica to Jacksonville. Vital for energy, chemical, and agricultural products from the Sun Belt.
- I-80 Corridor: East-west artery connecting San Francisco to New Jersey. Agricultural raw materials and heavy industrial equipment.
- I-95 Corridor: Connects the dense markets of the East Coast. Critical route but with extreme levels of congestion.
Chapter 6: Technology and Innovation in FTL
Technology has gone from being a differentiator to becoming a baseline requirement. Fleets that don't adopt digital solutions face exclusion from contracts with major shippers and higher operating costs.
Real-Time Visibility
Tracking technology is no longer a luxury, but what the industry calls "table stakes"—the minimum necessary to participate. Shippers demand:
- Real-time GPS with frequent updates
- Dynamic ETAs based on traffic conditions
- Proactive exception alerts
- Temperature monitoring for refrigerated loads
Combating Freight Fraud
Freight fraud has reached alarming levels, with increasingly sophisticated methods:
- Identity theft: Impersonation of legitimate carriers
- Double brokering: Unauthorized re-brokering of loads
- Fictitious carrier: Ghost companies with falsified documentation
Digital platforms and artificial intelligence are emerging as critical tools for identity verification and anomalous pattern detection.
AI for Operational Optimization
Artificial intelligence is transforming multiple aspects of operations:
- Route optimization: Reduction of empty miles and transit time
- Automated dispatch: Intelligent load-to-driver assignment
- Appointment scheduling: Reduction of unpaid waiting time
- Predictive maintenance: Anticipation of mechanical failures
Advanced Driver Assistance Systems (ADAS)
ADAS systems represent the bridge to a safer future without replacing the human driver:
- Automatic emergency braking
- Lane departure warning
- Adaptive cruise control
- Driver fatigue detection
"Data-driven" fleets that integrate these technologies position themselves as the strategic differentiator in the market.
Chapter 7: Strategies for Shippers
In a transitioning market, shippers must adapt their transportation procurement strategies to maintain competitiveness and secure capacity. Tactics that worked in an oversupply market will not be effective in a tight capacity environment.
Mode Diversification
A robust transportation strategy must consider multiple options:
- FTL: Optimal for full loads, dedicated routes, and critical timelines
- Intermodal: Cost savings on long distances (+500 miles) when time permits
- Consolidated LTL: For volumes that don't justify a full truck
The key is to evaluate each lane individually, not apply a one-size-fits-all solution for the entire operation.
Updating Routing Guides
Given market volatility, the traditional practice of annually updating routing guides is obsolete. Current best practices include:
- Quarterly reviews: Rate and provider adjustment every 90 days
- Tactical mini-bids: Focused bids on problematic lanes
- Price band contracts: Flexibility to adjust based on market conditions
Produce Season
Agricultural seasonality causes drastic changes in refrigerated equipment demand and rates. Load-to-truck ratios can exceed 9 to 1 during peak periods like June.
Cycle by Season:
- Spring (March-May): Florida and southern Georgia dominate with watermelons, peaches, and blueberries. Reefer rates reach highs in May.
- Summer (June-August): California accelerates with strawberries and citrus. The Midwest harvests corn and soybeans. July spikes demand for meats and dairy.
- Fall (September-November): Northwest with apples and potatoes from Washington and Idaho. Southwest with peppers and onions.
- Winter (December-February): Arizona Yuma as the world capital of lettuce. Vegetable imports from Mexico maintain constant demand.
Building Carrier Relationships
In a tight capacity market, long-term relationships with reliable carriers are worth more than optimizing every penny:
- Reasonable and paid detention times
- Proactive communication about volume changes
- Prompt payment (net-15 or better)
- Driver-friendly facilities
Chapter 8: Conclusions and Projections 2026-2035

The ground transportation market in the United States demands a sophistication that transcends simple asset movement. The convergence of a tight capacity market, strict environmental regulations, and the nearshoring explosion creates a unique opportunity for carriers and forwarders operating under a high-quality, human-centered model.
Projections Toward 2035
- Freight volume: Expected to reach 14 billion tons annually
- Industry revenue: Projection of $1.46 trillion dollars
- Consolidation: Large fleets will acquire small ones to gain scale and technology
- Truck's role: Irreplaceable in the "last mile" of manufacturing and omnichannel retail
The Strategic Differentiator
The ability to integrate FTL services with equipment specialization (reefers, tankers, flatbeds) and a solid presence in the Mexico-United States cross-border corridor is the key strategic differentiator for this decade.
The future belongs to "data-driven" fleets that:
- Optimize every mile traveled to reduce costs
- Protect driver integrity
- Minimize environmental impact through certified technologies
Shipper Priorities
Tomorrow's shippers will prioritize:
- Reliability: Consistent fulfillment of service commitments
- Visibility: Real-time information on load location and status
- ESG Alignment: Compliance with Environmental, Social, and Governance standards
- Flexibility: Ability to adapt to disruptions
The Human-Technology Balance
Those players who achieve a balance between technological efficiency and a deeply human approach to workforce management will be the ones who lead the recovery and growth of the world's most important logistics network.
Technology should serve the driver, not replace them. Route optimization should consider operator well-being. Data should inform decisions, not dictate them blindly.
Final Message
Trucking will remain irreplaceable. In a world of complex supply chains, accelerated e-commerce, and distributed manufacturing, the truck is the link that connects factories to distribution centers, ports to cities, and products to consumers.
The question is not whether ground transportation will survive—the question is which companies will lead its transformation toward a more efficient, safer, and more human future.
References
ATA American Trucking Trends 2025 - trucking.org
ATA American Trucking Trends 2025 - atabusinesssolutions.com
Truck Freight to Bounce Back in 2025, ATA Projects - trucking.org
United States Full-Truck-Load (FTL) Market Forecasts to 2031 - mordorintelligence.com
United States Freight & Logistics Market Forecasts 2031 - mordorintelligence.com
Q4 2025 Truckload Market Forecast: Rate & Capacity Trends - RXO
Trucking Industry Forecast for 2026 - ACT Research
Market Update January 2026 - BM2 Freight
2026 Freight Market & Trucking Industry Trends - Ryder
North America Cross Border Road Freight Transport Market 2026-2031 - GlobeNewswire
US Tank Trucking Market - mordorintelligence.com
Produce Season 2025: How to Secure Capacity - GFC Logistics
Specialized Freight Trucking Market Report 2026 - thebusinessresearchcompany.com
Environment & Sustainability Certification - IATA
Best US Cities for Trucking in 2025 - Summar Financial
Top 10 Logistics Hubs in the United States - Logos 3PL
Top 10 US Ports 2025: Gateways to Global Trade - FreightAmigo
Major Freight Corridors - FHWA
The DFW Interstate Highway System - Partners Real Estate
Top 10 U.S. States for Freight and Trucking - Logos Logistics
Major Freight Routes in the USA - truckdriversus.com
Mexico Border - Texas DOT
TransBorder Freight Annual Report 2024 - BTS
International Trade – Laredo EDC - laredoedc.org
US–Mexico Cross-Border Logistics: Nearshoring Trends for 2026 - Cooperative Logistics Network
Latin America Trade Shifts 2026 - EP Logistics
2025 Produce Season - FreightCaviar
North American Produce Transportation 2024-2025 - Ready 2 Xecute
2025 Guide to Produce Season Freight Market - New Light Enterprises
Mexico Transport Cost Indicator Report Q4 2024 - USDA
C-TPAT & PIP Guide - Switchboard
C-TPAT, PIP Certificate - All Trucking Solutions
CSA Scores Guide - Amazon Relay
CSA Driver Resources - FMCSA
EPA Phase 3 Rule Overview - CALSTART
Final Rule: GHG Emissions Standards for Heavy-Duty Vehicles – Phase 3 - EPA
Heavy-Duty Standards Workshop - CARB
Trucking Industry Environmental Wins 2025 - trucking.org
2026 Fleet Driver Safety Trends Report - Mike Albert Fleet Solutions
Top Challenges Trucking Industry 2026 - Rush Truck Centers
The Future of Trucking in 2026 - America Truck Driving
Best States for Trucking Business - Vektor TMS
Trucking Industry Info by State - TheTrucker.com
5 Best and Worst States for Freight - DAT
5 U.S. Cities Becoming High-Growth Logistics Hubs - Global Trade Magazine
Download the whitepaper
Enter your details and we'll send the download link to your email.